How TDFragMapper works

This Nature Protocol Exchange explains how TDFragMapper works and how the parameters must be used. There are many details that need to be read carefully.
Get started
After installing TDFragMapper, the user is able to compare experimental parameters and eases the selection of optimal fragmentation parameters in order to increase confidence in protein identification and characterize post-translational modifications by top-down proteomics.
1. Follow the step by step below to load all the necessary files and perform the first data evaluation.
- In Supplementary files, download the protein database that contains a single protein sequence.
- Also in Supplementary files, download the data files generated by ProSight Lite, and for each one, specify* a Fragmentation Method, an Activation Level, a Precursor Charge State, a Replicate and the path to the MS/MS Data file. Specify a Deconvoluted Spectra file that was generated by Thermo® FreeStyleTM software (Xtract algorithm) whether an evaluation of fragment ions intensity is desired. (These files can also be found in Supplementary files) *Instead of filling file by file, the user has the possibility to fill multiple data files at once by copying from a table (e.g., Excel® file), and pasting by right-clicking on the table or pressing CTRL + V.
- By clicking on Next step button, the Filter tab will be enabled. And now will be necessary to create the desired map(s).
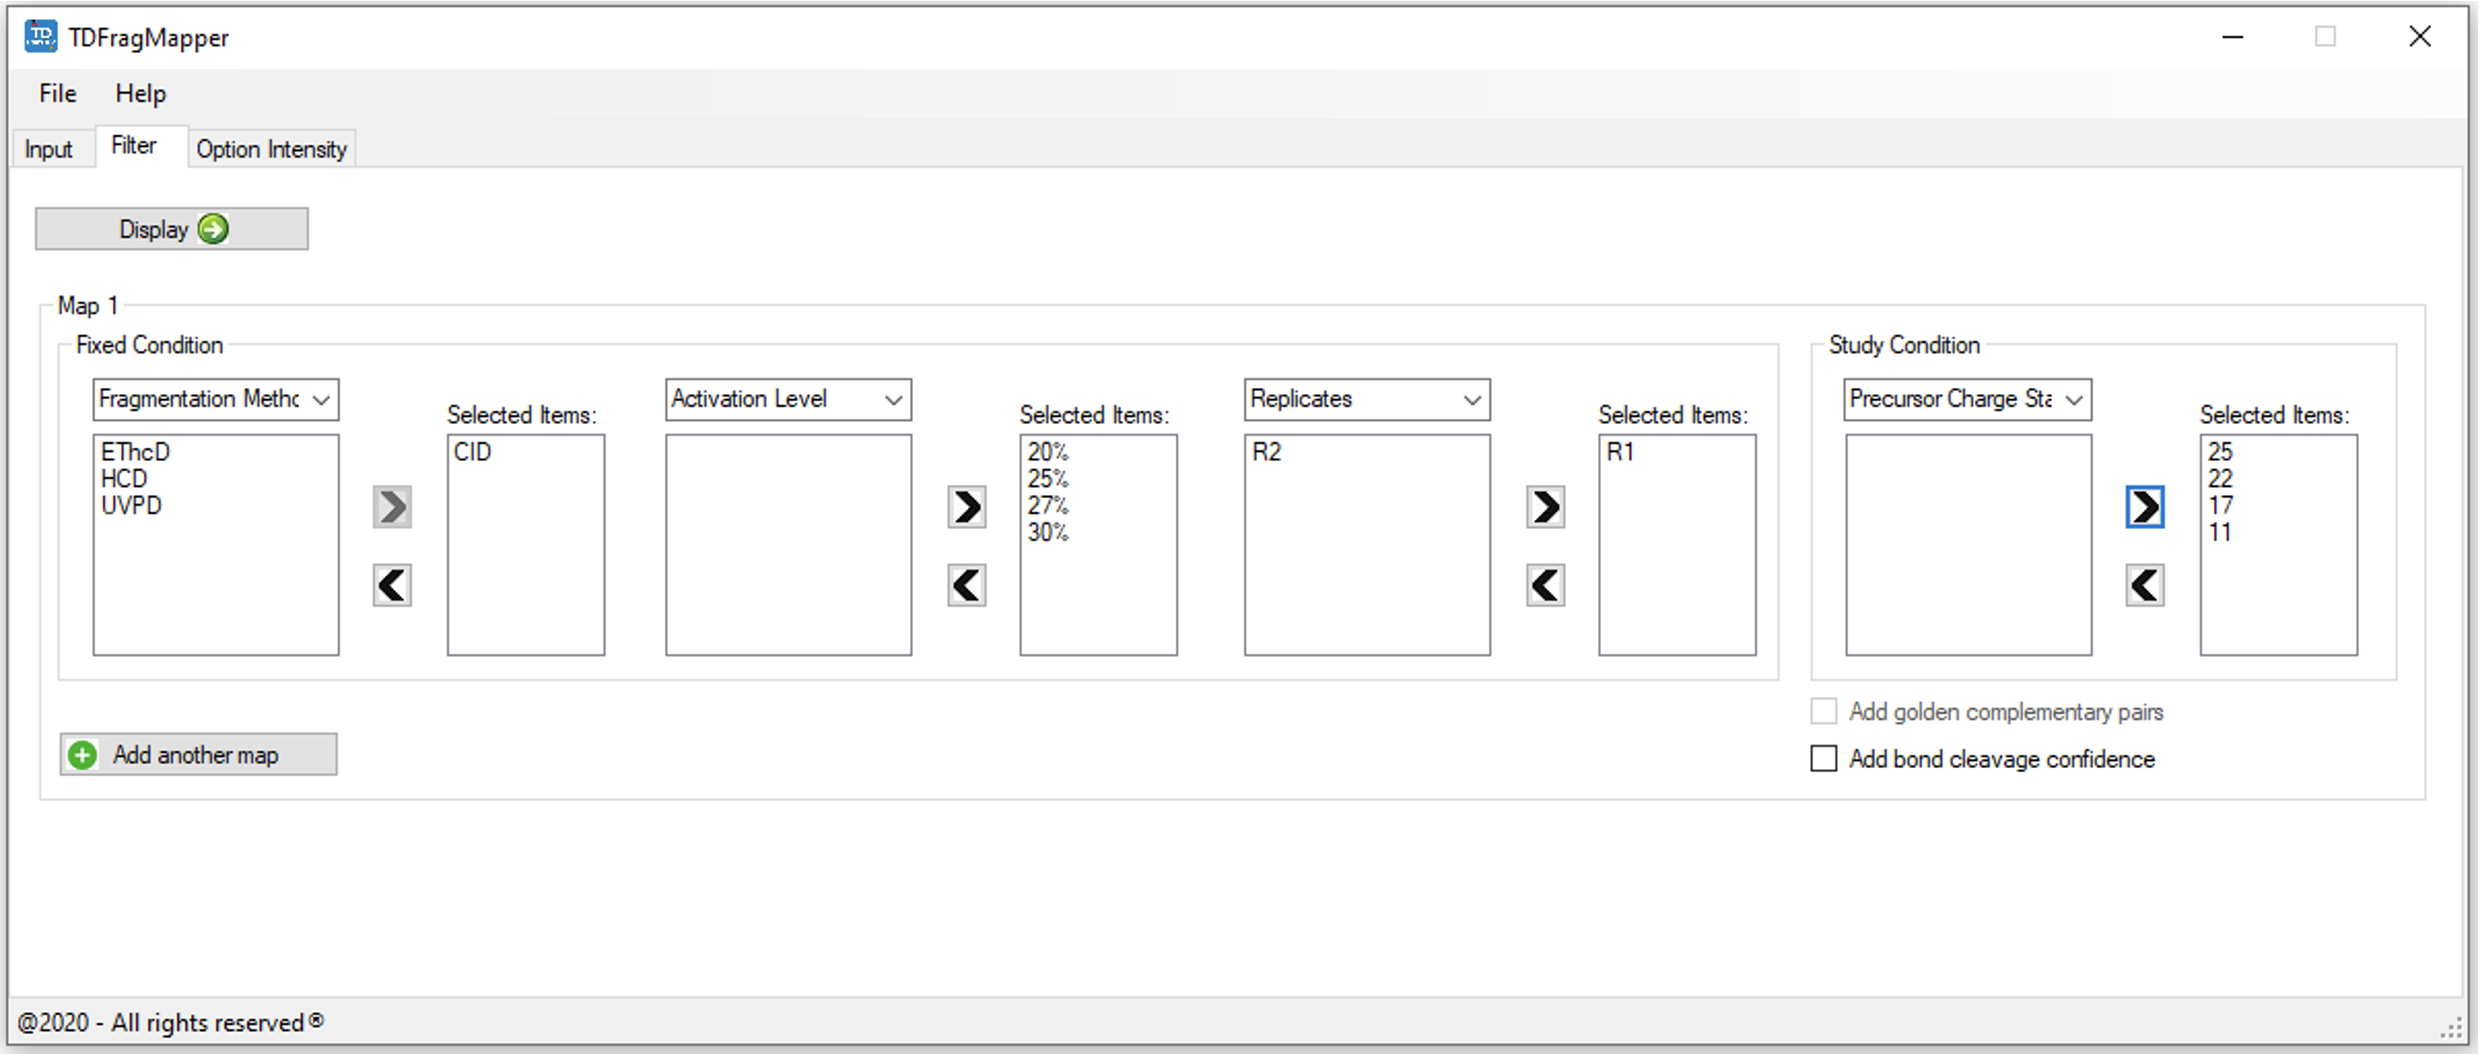
- To create a study map, three fixed conditions and one study condition need to be set up. The conditions* can be selected by using the associated drop-down menu. *Available options: Fragmentation Method, Activation Level, Replicates and Precursor Charge State.
- For each selected condition, all associated values found in the input tab are displayed in the left list. Desired values* can be selected or removed using the arrow buttons. TDFragMapper will apply default colors to the selected values of the study condition. To change the colors, double click on the selected value, choose a new color and validate with the OK button. *For Fragmentation Method as first fixed condition, only one value is allowed to be selected.
- The user can also display golden complementary pairs on the final result image. Golden complementary pairs will be represented as a star (*) under the corresponding inter-residue cleavage. This option is allowed for maps with only 1 selected value per fixed condition.
- The bond cleavage confidence can be added to map, which will add a color scale onto the protein sequence to highlight confidence in each proteolytic bond cleavage. The greater the number of matched fragment ions the darker the amino acid color.
- To display the fragmentation maps of the intact protein, click on the Display button. A new window will open.
2. Follow the step by step below to load a data evaluation performed as example.
- In Supplementary files, download the TDFragMapper output file (*.tdfm). PS: Uncompress tdfragmapper-output.zip for obtaining the *.tdfm file.
- Load the TDFragMapper result, by clicking on File menu → Load Results (or press CTRL + O) and select the results.tdfm downloaded from step 1.
- A new window is open.
- The result file (*.tdfm) can be open just by double-clicking on it.
Note: The images below summarize how TDFragMapper works.
Figure 1 shows the main Graphical User Interface of TDFragMapper. It provides many features to evaluate experimental parameters and eases the selection of optimal fragmentation parameters (Figure 2a and Figure 2b).
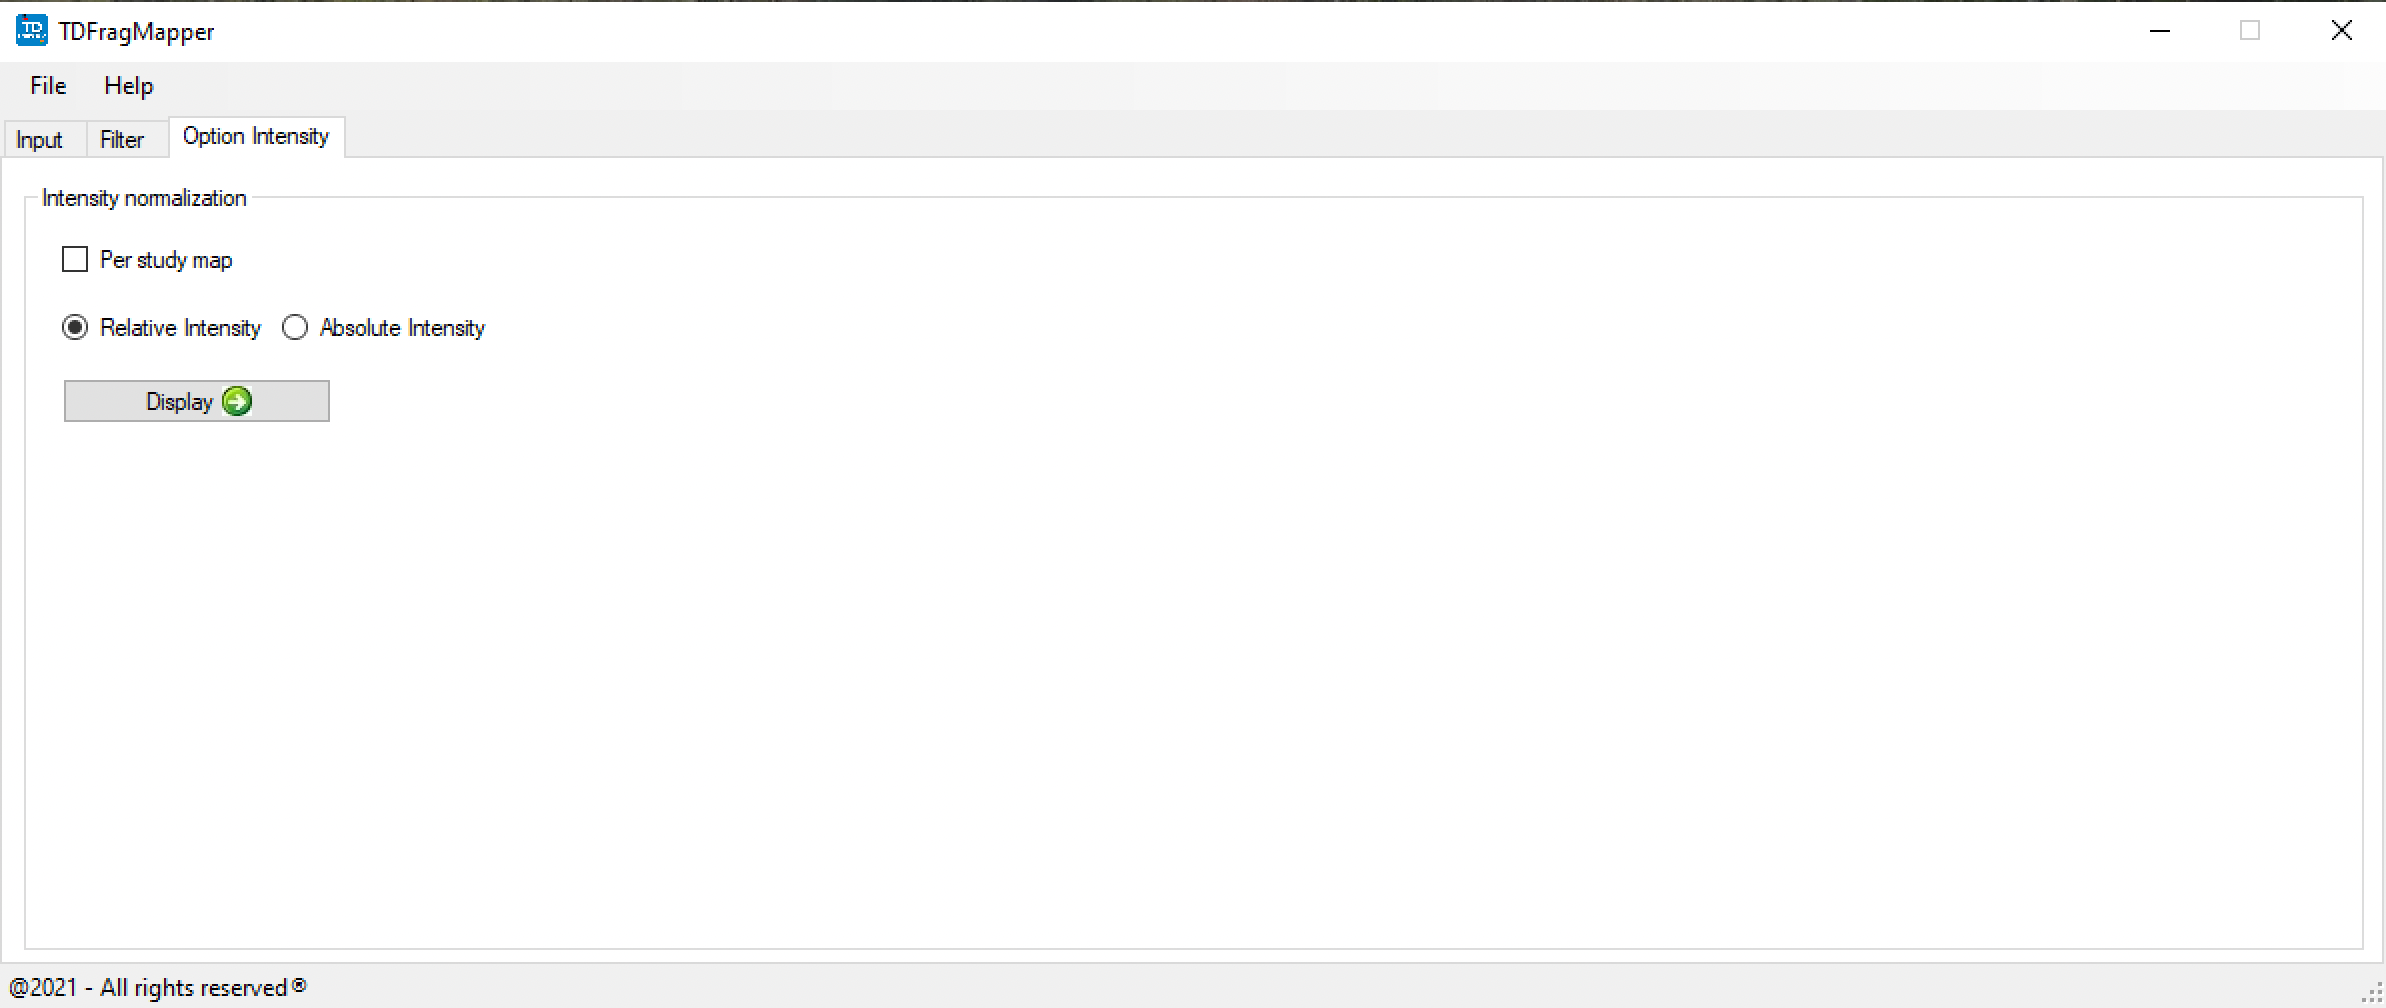
Once all data is loaded, a dynamic map is generated (Figure 3) and different analyses can be performed by taking into account not only different precursor charge states, the percentage of residue cleavages and the number of matching fragments, but also the intensity of fragments (Figure 4) and the bond cleavage confidence (Figure 5).


